
ABC Co. · Fullerton, CA · 86.9 kW DC system
Executive Summary
YOUR SOLAR COMPANY's June 17 cleaning increased solar production, adding an estimated $1,190 in annual solar value for ABC Co. — bringing total projected annual solar value to $20,785 with cleaning maintained, versus $19,595 measured without it. The result is weather-adjusted and based on ABC Co.'s avoided electricity costs. Weather-normalized output rose 14.5% after cleaning, and peak power rose 12.8%.
Projected Annual Gain
What "no cleaning" actually looks like
This isn't hypothetical — it's what we already measured. The prior 12 months of this account's data (the same figures behind its annual solar report) cover a full year with no cleaning event on record, ending in the soiled state captured right before YOUR SOLAR COMPANY's visit.
| Scenario | Annual avoided cost |
|---|---|
| No cleaning (measured, prior 12 months) | $19,595.10 |
| With annual cleaning, maintained near post-clean level | $20,784.74 |
Recommendation
Continue the annual cleaning program. This holds under every scenario we modeled, including what "doing nothing" actually looks like based on this account's own prior-year data (see the comparison above) and the plateau-vs-progressive soiling question addressed in How We Calculated.
The proof
What We Measured
15 days of production before the cleaning, 6 days after, normalized against each day's actual measured sunlight — so the numbers below are the cleaning effect, with weather already subtracted out.
| Period | Days | Avg. daily output | Normalized yield | Avg. peak power |
|---|---|---|---|---|
| Before cleaning Jun 2–16, 2026 |
15 | 420.2 kWh | 14.29 kWh/MJ·m² | 50.7 kW |
| After cleaning Jun 17–22, 2026 |
6 | 450.6 kWh | 16.36 kWh/MJ·m² | 57.2 kW |
| Change | +7.2% | +14.5% | +12.8% |
"Avg. peak power" is the array's own daily output peak (11am–2pm), not the account's demand-charge-setting interval (~8:30–9am) — the two don't currently show the same improvement. See How We Calculated for why we don't attach a dollar figure to this number.
Every day in the comparison window
The two shorter bars in the "after" group (6/18, 6/19) are documented marine-layer mornings, not equipment — see How We Calculated.
For the technically curious
How We Calculated
Every step, in plain language. The numbers in this report are real — measured from an actual solar installation. The customer name has been replaced with “ABC Co.” for this sample, but the production data, irradiance model, billing rates, and ROI figures are all drawn from a live account.
Why we normalize for weather instead of comparing raw kWh
Raw daily output swings roughly 40% day to day just from cloud cover — far bigger than any plausible cleaning effect. Comparing raw kWh before and after would mostly measure the weather during those two weeks, not the cleaning. We instead divide each day's production by that day's actual measured sunlight (irradiance), so cloudy and clear days become directly comparable.
The irradiance model: plane-of-array, not a flat-surface proxy
ABC Co.'s array is tilted 15°, facing true south. A tilted surface receives a different mix of sunlight through the year than a flat one does — so we compute real plane-of-array (POA) irradiance: actual sun position for every hour of the comparison window, transposed onto the array's specific tilt and orientation, using each hour's measured direct and diffuse sunlight components (not a single flat-surface irradiance number). This is the same class of calculation solar engineers use to model expected array output.
We validated this against the simpler flat-surface estimate: the two methods agree closely for this short, same-month comparison window (+14.5% vs. +13.6%), which is expected since geometry effects are largest across seasons, not within two adjacent weeks in June.
Cross-checked against SCE's independent meter
SolarEdge's own monitoring is the primary data source, but we don't take it on faith. For the days where SCE's own grid meter data is available, exported energy never exceeds SolarEdge's reported production on any day — a basic physical consistency check that has to hold true, and does.
Why the two lower after-cleaning days don't break the result
June 18 and 19 show a smaller uplift than the other four after-cleaning days. Hour-by-hour production on those two days shows a classic Southern California marine-layer signature — suppressed output through mid-morning, then a sharp ramp around 11am as the overcast burns off. The same pattern appears on at least one before-cleaning day (June 6). It's weather, not equipment, and the average holds either way.
The soiling "blanket effect" — and what happens if it's not cleaned
Soiling doesn't just block light — the dust layer itself absorbs solar energy and can raise panel temperature, which then further reduces output through the normal temperature efficiency penalty all silicon panels have. Published research documents temperature increases from soiling in the range of roughly 1–10°C depending on dust density, compounding on top of the direct light-blocking loss.
Published soiling-loss studies put typical losses in the 3–14% range, rising to 20–50%+ in arid regions or after long neglect. ABC Co.'s measured 14.5% sits at the upper end of the normal range — consistent with an array that had gone a while without cleaning, not an outlier result.
Why isn't there a demand-charge line in the dollar figure?
An earlier version of this report included one, based on the array's own peak output increasing 12.8% after cleaning. We pulled it after checking the timing more carefully: this account's actual demand-charge-setting interval occurs at approximately 8:30–9:00am, but solar's own daily peak consistently occurs between 11am and 2pm — both before and after cleaning. Those are two different times of day, so an increase in the array's midday peak doesn't automatically mean anything for the specific 15-minute interval the utility bill actually uses.
We checked output specifically at 8:30–9:00am, before vs. after cleaning, and it did not show the same improvement the midday peak did — if anything it was flat to lower in this small sample, though weather noise (two of the six after-cleaning mornings had marine-layer cloud cover) makes that inconclusive rather than a confirmed decline either way.
Rather than publish a number we can't stand behind, we removed it. The $1,189.64/yr figure in the Executive Summary is energy savings only, and we're confident in it. If a validated demand-charge estimate becomes possible with more data, we'll add it back with the same rigor.
This doesn't mean the demand-charge opportunity is zero — it means we haven't confirmed it yet. The array's overall capacity clearly improved; whether that reaches the 8:30–9am window enough to matter is still an open question, not a closed one. Worth revisiting once more post-cleaning data accumulates, and possibly worth a closer look at whether load can be shifted later into the morning to capture more of what solar already offers.
Does skipping a year make it worse, or does it just stay flat?
Honest answer: we only have one soiling data point for this array (the state it reached after roughly a year with no cleaning), so we can't yet say for certain what a second uncleaned year would look like. There are two documented possibilities in the research:
- Plateau case: light dust and pollen often reach a rain-washing equilibrium and don't keep compounding indefinitely — in this case, skipping cleaning just means staying at the $19,595/yr level we already measured, with no further known decline.
- Progressive case: published soiling research documents a real mechanism called cementation — dust bonding to the panel surface via humidity/dew cycling, turning rain-removable dust into a rain-resistant crust. Once that happens, simple weather exposure stops helping and losses can compound rather than plateau.
Either way, the recommendation doesn't change — the $1,189.64/yr figure already reflects the conservative (plateau) assumption. The progressive case only means there's more value at stake than that number captures.
Source: Cleaning of Photovoltaic Modules through Rain: Experimental Study and Modeling Approaches, Solar RRLCleaning ROI — ABC Co.
Sources
| Data | Source |
|---|---|
| Production (15-minute) | SolarEdge monitoring, site 7836421 |
| Grid import/export | SCE Green Button interval data, account 3927561840 |
| Solar irradiance | Historical archive, site coordinates, hourly direct + diffuse components |
| Avoided-cost rates | ABC Co.'s own SCE TOU-GS-2-D billing-cycle reconciliation |
What We Reviewed
- Six days of after-cleaning data. The direction and size of the effect are consistent across every check we've run, but the sample will keep growing as more days come in — this report will be updated as they do.
- Not a fully instrumented experiment. Weather normalization removes most of the confound, but we don't have on-site pyranometer or panel-temperature data — a regional archive and a geometric model are strong proxies, not perfect ones.
- 14.5% is on the high end for typical soiling gains (commonly 2–8%), which most likely reflects a longer-than-usual interval since this array's last cleaning, not a modeling artifact.
- This report includes energy savings only, not demand-charge savings. We found the array's own peak-output improvement occurs at a different time of day (11am–2pm) than the account's demand-charge-setting interval (~8:30–9am), so we couldn't validate a dollar figure for demand-charge impact and removed it rather than publish an unsupported number. Full explanation above, under “Why isn't there a demand-charge line in the dollar figure?”
Site documentation
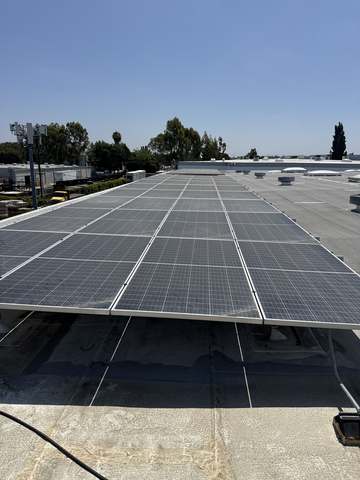
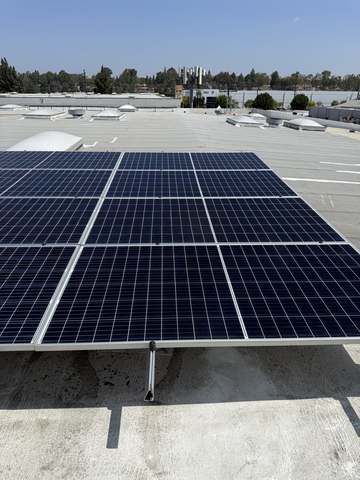
Before & After Photos
Photos from the site visit.
We measure what cleaning is actually worth.
UtilityBillScope pairs interval-level production data with independent weather normalization to put a real, defensible number on a cleaning service's impact. If you clean solar arrays, we'll help you show it.